Practical Statistics 3: Powering up! Descriptive and Inferential Statistics
Task 1: Descriptive statistics using tidyverse
Question: Compute the summary statistics (count, mean, standard deviation, minimum, and maximum) of age using tidyverse functions.
Steps:
Install and load the tidyverse package.
Filter the dataset to remove missing values in the “age” column (Note there are no missing values in the dataset- the task is simply meant to simulate the code that would be required if there were).
Use the summary functions from
dplyrto compute the required summary statistics. In this case- count, mean, standard deviation, minimum, and maximum
Task 2: Descriptive statistics using gtsummary
Question: Create a descriptive statistics table for age, male, bid, and malaysian variables using gtsummary.
Steps:
Install and load the
gtsummarypackage.Create a subset of the data with the selected variables (Note: Select any five variables).
Use the
tbl_summary()function to compute and display the descriptive statistics.Stratify by any other selected variable.
Task 3: Inferential statistics using rstatix
Question: Test if there is a significant difference in age between males and females using the t-test.
Steps:
Install and load the
rstatixpackage.Filter the dataset to remove missing values in the “age” and “male” columns.
Recode the “male” variable to factor.
Conduct a t-test to compare the means.
Task 4: Inferential statistics using gtsummary
Question: Test if there is a significant difference in age between Malaysians and non-Malaysians using the t-test, and present the results in a table using gtsummary.
Steps:
Recode the “malaysian” variable to factor (Tip: Use the factor function).
Use the
tbl_summary()function to present the results.
Solution:
Task 5: Correlations using corrr
Question: Compute the correlation between age, male, bid, and malaysian variables, and represent it in a correlation plot (Note: The selection of categorical variables is by design- just to practice the selection and presentation)
Steps:
Install and load the
corrrpackage.Create a subset of the data with the selected variables.
Compute the correlation matrix (Note: Try ?network_plot and see how this can be used)
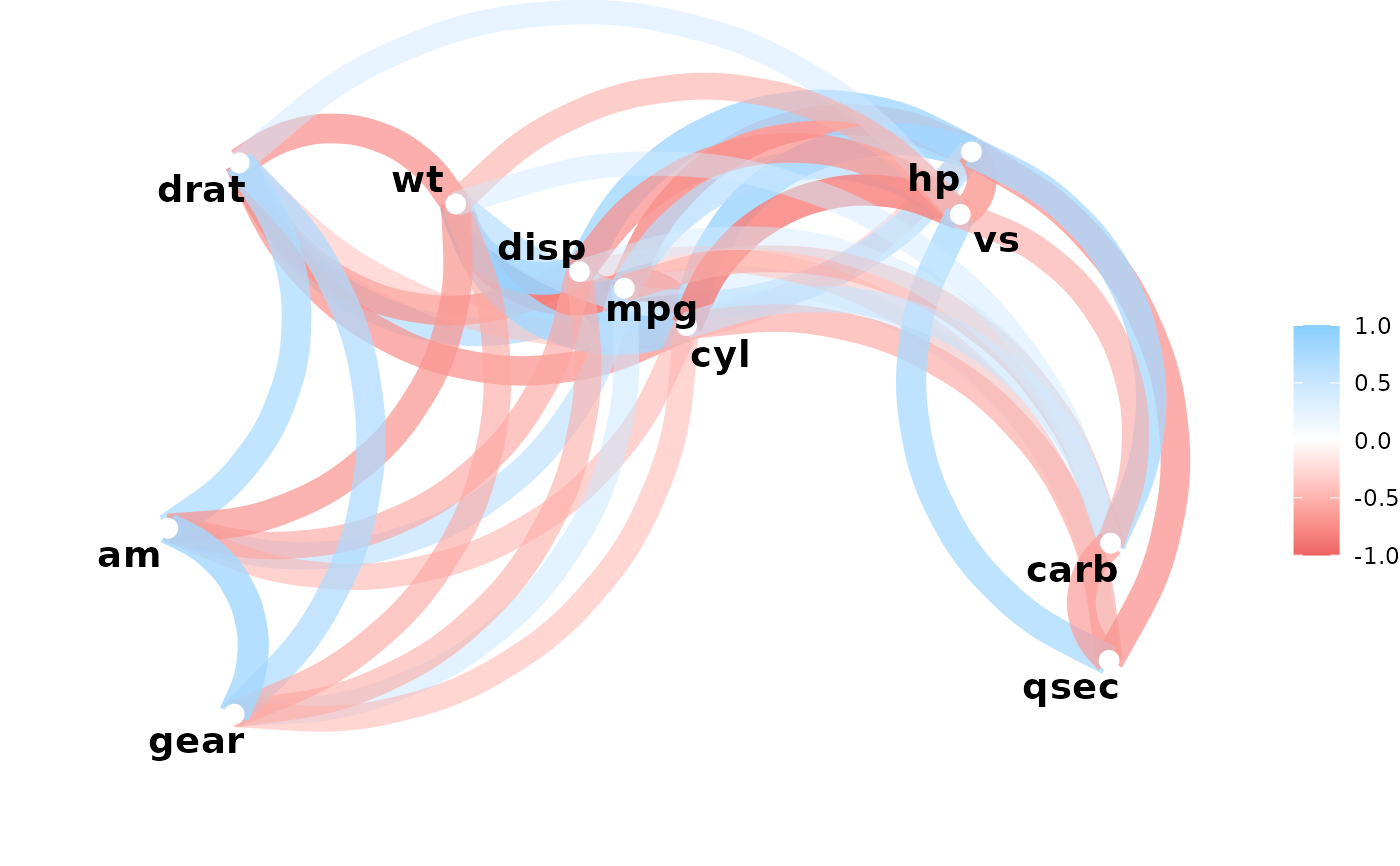
This would be the outcome if anything was highly correlated in our data.